DATA COLLECTION AND ANALYSIS
WAYS ASSESSMENT INFORMATION INFLUENCED DECISIONS
Based on the test scores after the implementation of guided notes, I decided to continue utilizing guided notes throughout the rest of my research. This decision was based on the fact that 23 out of my 26 students increased their scores after the implementation of guided notes. The guided notes continued to be supplemental to the rest of the strategies I introduced during my research.
Throughout my study, I monitored my students’ progress by examining their notes. The students’ abilities to take notes showed me that they were grasping the concept of note taking and how to utilize graphic organizers. Gradual release was utilized throughout the research process. At the beginning of each method (guided notes, outlining, and the Cornell method), I modeled the process for the students. Then they would assist me in completing the notes or graphic organizer. I would then have my students work together. I would observe the students working together and would identify students who needed extra support. This decision was based on students becoming frustrated or simply not writing much down. I had those students work with me on completing the notes. Students were also given the opportunity to work in a small group with me if they were not confident in their abilities to successfully complete the notes. At the beginning of note taking, I made sure to meet with my struggling readers to provide extra assistance. I felt this was necessary as note taking requires being able to identify the main idea of what is being learned. Eventually, these students no longer needed my assistance and were able to successfully complete the notes individually.
As I was observing one student, I noticed that his small motor dexterity was creating difficulties for him as his handwriting was illegible. Additionally, he struggled to keep the pace of the rest of the class. Based on these two observations, I decided it would be best for him to type his notes instead of writing them by hand so that he could focus more on the content and less on the writing. After examining student notes from working with partners, I decided that my students were ready to take notes individually. At this point, the majority of the students had no problem taking their own notes.
When introducing the Cornell graphic organizer, I utilized the data I had collected during the outlining method to inform my decision to release responsibility to the students more quickly. The main section of the Cornell organizer was based on what the students had already learned when completing the outlining method. Based on the prior experience my students had with note taking, I did not find it necessary to spend a lot of time teaching the Cornell method. Again, I made sure to meet with my struggling readers as part of the Cornell method was summarizing.
Due to six snow days, there was not enough time to effectively incorporate each of the strategies originally detailed in my action plan. I utilized data collected from observations of how my students were progressing through the outlining method to determine whether to use the Cornell method or the KWHHL chart. Based on the fact that more students were beginning to feel confident in completing the outlining method, I decided to implement the Cornell method. The Cornell method is a graphic organizer; however, it is comprised of elements very similar to outlining. I felt that my students would be more successful with the Cornell method as they were already becoming comfortable with the outlining method.
DATA COLLECTION METHOD: STUDENT INTERVIEWS
In order to determine whether or not the implementation of note taking methods and graphic organizers increased student understanding in social studies, I needed to choose data collection methods that would represent student progress throughout the research and ultimately their growth, or lack thereof, from beginning to end. One data collection method I utilized was student interviews. Prior to implementing my research, I interviewed my students to gauge their thoughts and feelings about note taking and graphic organizers in social studies and whether or not they are helpful. After my research, I asked the same questions. I chose this data collection method as a way to determine whether or not my students’ attitudes toward note taking changed throughout my research as attitude can affect performance.
|
|
DATA ANALYSIS: STUDENT INTERVIEWS
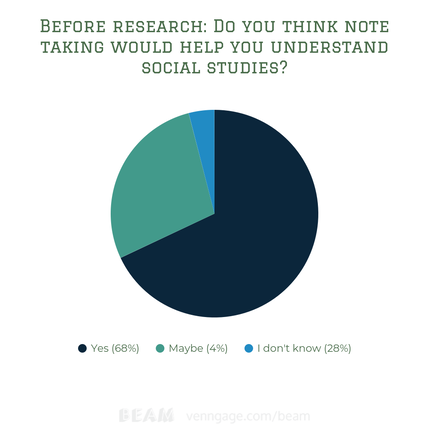
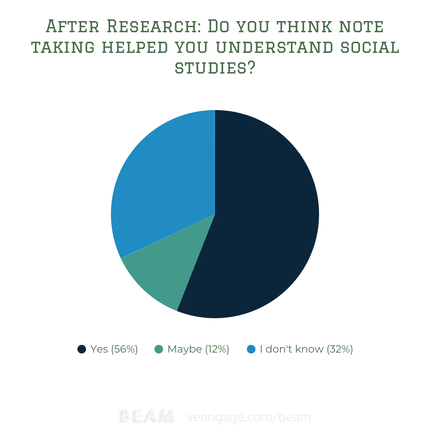
The graphs above represent whether or not students believed note taking assisted in understanding of social studies prior to and immediately following the implementation of my research. Before implementing the note taking strategies, 68% of students responded that they believed note taking would increase their understanding in social studies, 4% thought maybe, and 28% responded that they did not know. After the research, 56% responded yes, 12% responded maybe, and 32% responded that they did not know. The lack of confidence of note taking impacting understanding in social studies decreased from the beginning of the research to the end as students learned what note taking consisted of. Before implementing my research, my students had not experienced note taking in the classroom. Due to the lack of exposure, my students did not have a clear understanding of the note taking process.
|
|
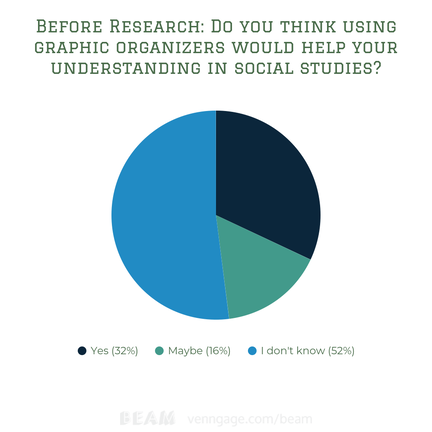
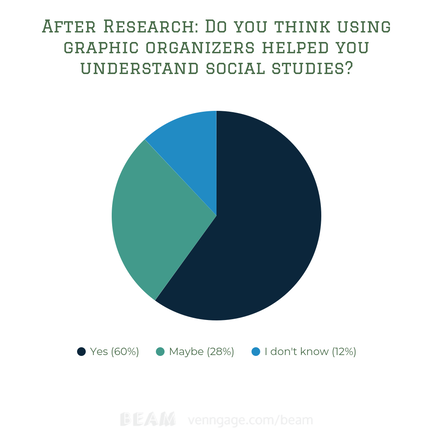
The graphs above represent whether or not students believed graphic organizers would help their understanding in social studies. Prior to my research, 32% responded yes, 16% responded maybe, and 52% responded that they did not know. After the research, 60% responded yes, 28% responded maybe, and 12% responded that they did not know. In the interview prior to introducing the Cornell method as a graphic organizer, many students indicated that their view of graphic organizers only consisted of Venn Diagrams. The lack of yes responses could be connected to the students’ skewed view of graphic organizers. As the students were exposed to a new graphic organizer, in the form of the Cornell method, they realized that graphic organizers can serve many purposes in their learning. This new outlook influenced students to have confidence in the ability of a graphic organizer to increase their understanding in social studies.
In considering both pieces of data, there is a correlation between responses to both questions following the research. At first, I questioned the drop in yes responses of the note taking and the significant increase of yes responses of the graphic organizer. After analyzing explanations of students in the pre-interview, I recognized that students did not have a clear understanding of the methods that were to be introduced. As students gained experience with both note taking and the use of a graphic organizer in social studies, their view on both transformed. In the post-research interviews, multiple students recognized that using the Cornell method as a graphic organizer required them to consider the material at a deeper level. The students’ opportunity to reflect on their thinking through the Cornell method resulted in an increase of yes responses in regards to the graphic organizer as opposed to the note taking method.
In considering both pieces of data, there is a correlation between responses to both questions following the research. At first, I questioned the drop in yes responses of the note taking and the significant increase of yes responses of the graphic organizer. After analyzing explanations of students in the pre-interview, I recognized that students did not have a clear understanding of the methods that were to be introduced. As students gained experience with both note taking and the use of a graphic organizer in social studies, their view on both transformed. In the post-research interviews, multiple students recognized that using the Cornell method as a graphic organizer required them to consider the material at a deeper level. The students’ opportunity to reflect on their thinking through the Cornell method resulted in an increase of yes responses in regards to the graphic organizer as opposed to the note taking method.
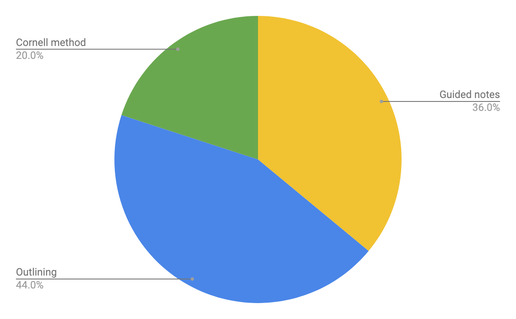
I also surveyed the students following the research in regards to their most preferred method of note taking or graphic organizer. The results are shown above. Surprisingly, guided notes were not the most preferred method at 36%. Outlining was the top method chosen at 44% with the Cornell method being the least preferred at 20%. This data shows that although students did not enjoy the Cornell method, it did provide assistance to them. The lack of interest in the Cornell method and the interest in the guided notes stems from students’ level of dislike when it comes to the amount of writing required for taking notes.
DATA COLLECTION METHOD: TEST SCORES
Another data collection method was a t-test. I considered a test my students took prior to the research as the baseline. Although I would not be giving the same test at the end, the test that was chosen as the baseline was reflective of each student’s typical performance. After each method of note taking or graphic organizer was introduced and taught, another test was given. I recorded the students’ scores after each method to compare to the baseline scores. This method was chosen as the purpose of my study was to identify whether or not the implementation of note taking strategies and graphic organizers would increase student understanding of social studies content. Being able to compare student scores from the beginning to the end of my research allowed me to analyze whether or not student understanding in social studies increased or not.
DATA ANALYSIS: TEST SCORES
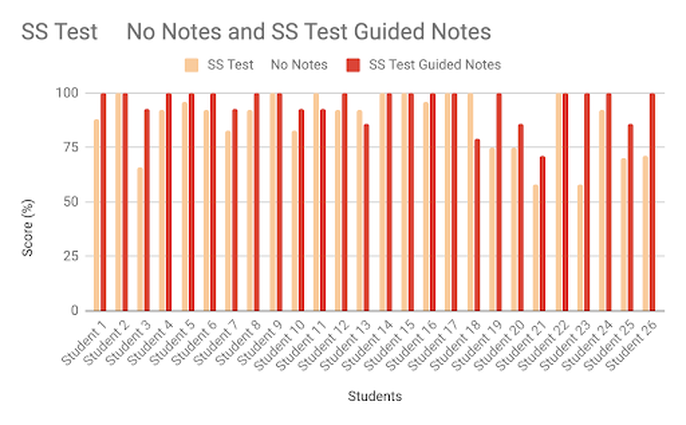
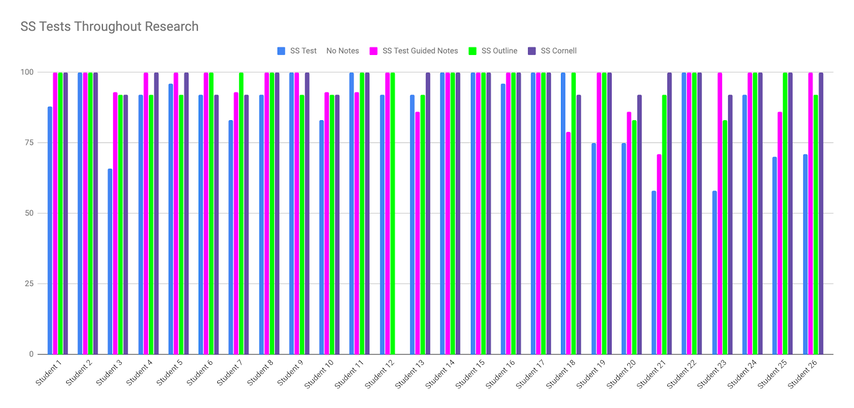
The graph above is representative of student scores with no note taking or graphic organizer in peach and scores with guided notes in red. Students were given guided notes for each section of the chapter. To begin, I went through the notes with the students. After the first section, students worked with a partner to complete the notes and then we checked as a class. The students then completed the notes individually and then checked with the class.
The data shows that 23 out of 26 students increased their test scores or remained the same after the implementation of guided notes. The students who remained the same after the implementation were students who had received a 100% on the baseline test. The largest impact was a 42% increase from no notes to guided notes which was demonstrated by student number 23. This student was one of my lowest readers, and likely benefited from working with me and a small group for a longer period of time before being expected to complete the notes individually. The smallest increase was seen from students 5 and 16. These are two of my highest readers and already had high scores to begin with. The students who dropped were students 11, 13, and 18. Student 18 experienced the largest drop of 21%. This student struggles with confidence in the classroom, especially when he feels unprepared. It is possible that this student did not adequately prepare through studying, and in turn, shut down when it was time to test. Students 11 and 13 are very confident but occasionally struggle with comprehension. Therefore, these students may have been confident in their abilities to complete the notes; however, they may not have been comprehending the meaning of what they were writing down.
The success of the rest of the students was likely affected by the amount of times the material was read over. Originally, students read through the section. Then, students completed the guided notes. After the notes were completed, the class went over the notes together to ensure that everyone was able to successfully complete them. The amount of exposure the students received from completing the guided notes increased greatly from not completing notes. The data points to the benefit of increased exposure to material through guided notes.
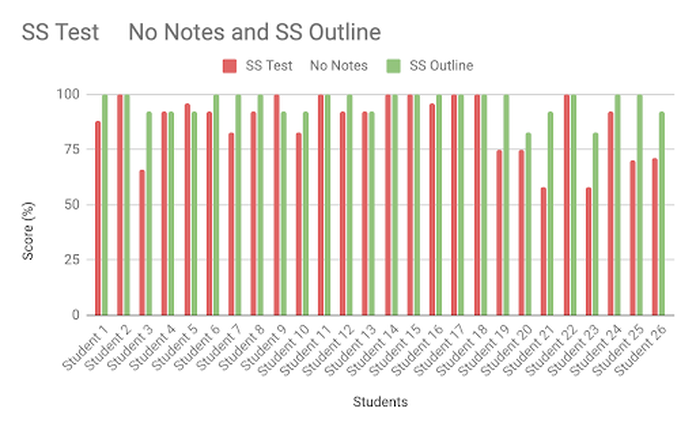
The graph above shows student scores with no note taking or graphic organizer in pink and scores with the outlining of notes in green. 24 out of 26 students either increased their scores from the no notes test or remained the same. The students who decreased were students 5 and 9. Student 5 only decreased by 4%. Student 9 decreased by 8%. During this time, student 5 was occasionally being pulled from class which led to loss of instructional time. This student was also dealing with struggles in and outside of school which could have affected her focus and performance. Throughout the implementation of guided notes, there were two snow days. One of the snow days fell on a Friday when the outlining test was scheduled. The test was pushed to the next week. These students may have been affected by their routine being thrown off with an unexpected three-day weekend. Although these students’ scores decreased, they both still received an A.
Students who increased exponentially were students number 3 and 21. Student number 3 struggled to remain focused throughout instruction. This student realized that the responsibility of completed notes was more so his than with the guided notes where he only had to fill in words. His identification of his heightened role in this method assisted him in remaining on-task and focused on the content in order to develop effective notes. Student number 21 was one of my lowest readers in the class. She struggled with comprehension as well as recall. Hand writing the notes increased this student’s ability to understand and remember the information as she was able to record the material in her own words. Students 3 and 21 both spent extra time with me guiding them through the process of outlining notes. At first, both struggled to identify the main idea of the material which is a large component of outlining; however, after extended time of guidance, both obtained confidence in their ability to complete the notes individually. This confidence carried over to the test.
Students who increased exponentially were students number 3 and 21. Student number 3 struggled to remain focused throughout instruction. This student realized that the responsibility of completed notes was more so his than with the guided notes where he only had to fill in words. His identification of his heightened role in this method assisted him in remaining on-task and focused on the content in order to develop effective notes. Student number 21 was one of my lowest readers in the class. She struggled with comprehension as well as recall. Hand writing the notes increased this student’s ability to understand and remember the information as she was able to record the material in her own words. Students 3 and 21 both spent extra time with me guiding them through the process of outlining notes. At first, both struggled to identify the main idea of the material which is a large component of outlining; however, after extended time of guidance, both obtained confidence in their ability to complete the notes individually. This confidence carried over to the test.
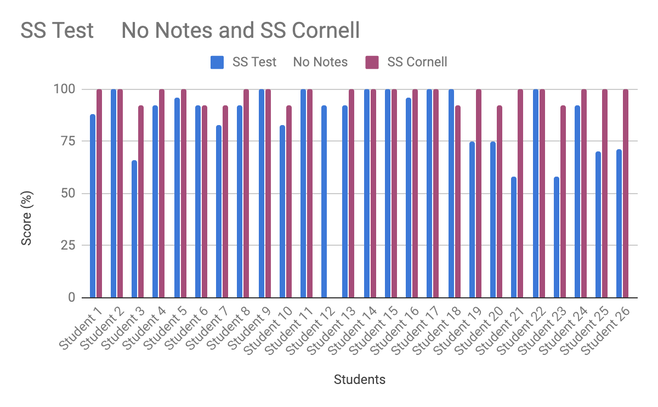
Above are the results of the test after the Cornell method was implemented compared to the results of the test with no notes. Student 12 has no data for this test as he was ill on the day of the exam. 24 out of 25 students grew or remained the same after the implementation of the Cornell method as a graphic organizer. Significant growth was seen from multiple students. Student 21 experienced the largest amount of growth at 42%. Her success with the outlining method likely impacted her success with the Cornell method as the two implementations are fairly similar. She appeared to be confident in her abilities to successfully complete the Cornell organizer as she did not desire to work with me when given the opportunity. She was also expected to be able to summarize the information covered in her notes. This required her to consider the information at a deeper level which led to her success. These reasons apply to the rest of the students who improved or remained the same. The data indicates that asking students to add a layer of thinking through questioning and summarizing improves understanding of the social studies content.
One student decreased but still received an A. This is the same student that decreased using the outlining method. It is possible that these methods of information recording are not how this specific student learns. All 25 students either scored a 92% or a 100% meaning that they either missed one or zero questions on the test. Although the majority of the students disliked this method, the data indicates that the Cornell organizer assisted students in increasing their understanding of social studies.
One student decreased but still received an A. This is the same student that decreased using the outlining method. It is possible that these methods of information recording are not how this specific student learns. All 25 students either scored a 92% or a 100% meaning that they either missed one or zero questions on the test. Although the majority of the students disliked this method, the data indicates that the Cornell organizer assisted students in increasing their understanding of social studies.
In the graph above, the scores from prior to the research are compared to the scores of each test given following the implementation of the variety of methods. Before conducting my research, there were seven students who scored a 75% or below on their social studies test. This was typical of the performance of each of these students.
Following my research, one student scored at or below a 75%, and that was only on one test. This was seen from student number 21. As analyzed in prior sections, this student made consistent growth throughout the whole research process. Her scores increased after each method was implemented. The data shows that she carried her skills and confidence from one method to the next as she continued to improve. After the guided notes test, no students scored below an 83%. The individual results of each method as well as the overall picture suggests the success of note taking and graphic organizers in developing understanding of social studies content.
Following my research, one student scored at or below a 75%, and that was only on one test. This was seen from student number 21. As analyzed in prior sections, this student made consistent growth throughout the whole research process. Her scores increased after each method was implemented. The data shows that she carried her skills and confidence from one method to the next as she continued to improve. After the guided notes test, no students scored below an 83%. The individual results of each method as well as the overall picture suggests the success of note taking and graphic organizers in developing understanding of social studies content.
DATA COLLECTION METHOD: OBSERVATIONS
The third data collection method was the observations I made over the span of my research. These observations were mostly comments made by students; however, I also observed body language at times as well. I chose to observe my students throughout the research so that I could identify their thoughts and feelings as they learned how to take notes and utilize graphic organizers in social studies.
DATA ANALYSIS: OBSERVATIONS
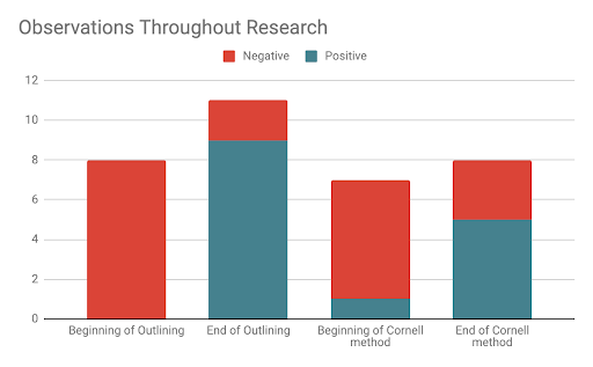
The graph above represents the attitudes of students as they progressed through the outlining and Cornell methods. When outlining began, multiple negative comments were made by students including “This is a lot to write,” “I don’t know what I am supposed to write,” “I need your help. I can’t do this.” Student body language also indicated a negative feeling toward the notes. As time progressed, the amount of negative attitudes quickly decreased as the positive outlooks increased. Comments such as “It isn’t so hard anymore,” “I think I’m starting to get this,” and “This is easy” were being made. At the beginning of the implementation, students were not used to taking notes. A majority of my students also did not like writing information down because it was a lot of work. The data shows that as students began to understand ways to make note taking easy rather than difficult, their beliefs began to change and their confidence increased. The data also indicates an unintended outcome of a lifelong learning skill of perseverance and a desire to grow. The same trend is seen with the Cornell method. Comments at the beginning were “I hate this,” “I don’t want to do it this way,” and “I can’t do this.” Part of this negativity is due to the fact that six snow days forced us to quickly move through the content which required students to complete multiple Cornell organizers in a short amount of time. After the completion of the research, comments made included “I am finally caught up! I was even able to write the last names of the Presidents!” “Wow! We didn’t like them but they actually did help us!” and “I remembered writing that in my notes!” Multiple students also commented “I don’t like doing it, but I can.” This data shows that students realized that although they may not enjoy something, it still can be done and done correctly. Although the students did not prefer the Cornell method, they did recognize their ability to utilize it as well as the benefits such as “It helps me organize the items.”
TRIANGULATION OF DATA
Individually, each data collection method shows the positive impact of note taking and graphic organizers in social studies achievement. When all three pieces of data are considered together, the benefits are even clearer. The increase of positivity throughout the research process directly correlates to the improved achievement of students, especially through the outlining and Cornell methods. The students’ beliefs in the ability of notes and graphic organizers to assist their understanding, even prior to the research, increased the chances of students remaining hopeful even through the difficult phases of the research process. The perseverance of the students throughout the research improved their attitudes and therefore improved their performance. The post interviews showed that students recognized the positive effect of each method which was reflective of their heightened achievement and positive outlooks.
